
The Liberal Democrats retained control of Tunbridge Wells Borough Council after the 2026 elections.
At the local elections held on May 7th 2026, the Liberal Democrats secured a dominant victory in Tunbridge Wells, winning 11 of the 15 seats contested across 13 wards. The council remains under the Liberal Democrats continuing as the largest party and holding the leadership.
Local Election Summary
The election results for the seats contested in 2026 are as follows:
- Liberal Democrats: 11 seats won
- Conservatives: 2 seats won
- Tunbridge Wells Alliance: 1 seat won
- Independents for Tunbridge Wells: 1 seat won
- Labour, Green Party, and Reform UK: 0 seats won
| Election Candidate | Party | Votes | % | Outcome |
|---|---|---|---|---|
| Conservatives | 1227 | 46% | Elected | |
| Reform UK | 674 | 25% | Not elected | |
| Liberal Democrats | 384 | 14% | Not elected | |
| Green Party | 370 | 14% | Not elected |
| Election Candidate | Party | Votes | % | Outcome |
|---|---|---|---|---|
| Liberal Democrats | 1402 | 49% | Elected | |
| Conservatives | 685 | 24% | Not elected | |
| Reform UK | 406 | 14% | Not elected | |
| Green Party | 230 | 8% | Not elected | |
| Labour | 85 | 3% | Not elected | |
| Independent | 27 | 1% | Not elected |
| Election Candidate | Party | Votes | % | Outcome |
|---|---|---|---|---|
| Tunbridge Wells Alliance | 943 | 32% | Elected | |
| Conservatives | 894 | 30% | Not elected | |
| Reform UK | 767 | 26% | Not elected | |
| Liberal Democrats | 373 | 13% | Not elected |
| Election Candidate | Party | Votes | % | Outcome |
|---|---|---|---|---|
| Liberal Democrats | 1195 | 39% | Elected | |
| Reform UK | 882 | 29% | Not elected | |
| Conservatives | 749 | 25% | Not elected | |
| Green Party | 207 | 7% | Not elected |
| Election Candidate | Party | Votes | % | Outcome |
|---|---|---|---|---|
| Liberal Democrats | 1246 | 41% | Elected | |
| Conservatives | 931 | 31% | Not elected | |
| Reform UK | 531 | 17% | Not elected | |
| Green Party | 232 | 8% | Not elected | |
| Labour | 100 | 3% | Not elected |
| Election Candidate | Party | Votes | % | Outcome |
|---|---|---|---|---|
| Liberal Democrats | 1515 | 48% | Elected | |
| Reform UK | 523 | 17% | Not elected | |
| Conservatives | 497 | 16% | Not elected | |
| Tunbridge Wells Alliance | 268 | 9% | Not elected | |
| Green Party | 250 | 8% | Not elected | |
| Labour | 91 | 3% | Not elected |
| Election Candidate | Party | Votes | % | Outcome |
|---|---|---|---|---|
| Independents for Tunbridge Wells | 934 | 30% | Elected | |
| Liberal Democrats | 916 | 29% | Not elected | |
| Reform UK | 659 | 21% | Not elected | |
| Conservatives | 466 | 15% | Not elected | |
| Green Party | 167 | 5% | Not elected |
| Election Candidate | Party | Votes | % | Outcome |
|---|---|---|---|---|
| Conservatives | 1474 | 37% | Elected | |
| Liberal Democrats | 1131 | 29% | Not elected | |
| Reform UK | 987 | 25% | Not elected | |
| Green Party | 274 | 7% | Not elected | |
| Labour | 73 | 2% | Not elected |
| Election Candidate | Party | Votes | % | Outcome |
|---|---|---|---|---|
| Liberal Democrats | 1192 | 34% | Elected | |
| Conservatives | 717 | 21% | Not elected | |
| Reform UK | 655 | 19% | Not elected | |
| Tunbridge Wells Alliance | 352 | 10% | Not elected | |
| Labour | 317 | 9% | Not elected | |
| Green Party | 264 | 8% | Not elected |
| Election Candidate | Party | Votes | % | Outcome |
|---|---|---|---|---|
| Liberal Democrats | 847 | 18% | Elected | |
| Liberal Democrats | 787 | 17% | Elected | |
| Reform UK | 592 | 13% | Not elected | |
| Reform UK | 549 | 12% | Not elected | |
| Conservatives | 453 | 10% | Not elected | |
| Green Party | 445 | 10% | Not elected | |
| Green Party | 420 | 9% | Not elected | |
| Conservatives | 384 | 8% | Not elected | |
| Labour | 176 | 4% | Not elected |
| Election Candidate | Party | Votes | % | Outcome |
|---|---|---|---|---|
| Liberal Democrats | 1614 | 25% | Elected | |
| Liberal Democrats | 1531 | 23% | Elected | |
| Reform UK | 719 | 11% | Not elected | |
| Reform UK | 675 | 10% | Not elected | |
| Conservatives | 652 | 10% | Not elected | |
| Conservatives | 615 | 9% | Not elected | |
| Green Party | 435 | 7% | Not elected | |
| Green Party | 280 | 4% | Not elected | |
| English Democrats | 62 | 1% | Not elected |
| Election Candidate | Party | Votes | % | Outcome |
|---|---|---|---|---|
| Liberal Democrats | 1478 | 58% | Elected | |
| Reform UK | 365 | 14% | Not elected | |
| Green Party | 316 | 12% | Not elected | |
| Conservatives | 271 | 11% | Not elected | |
| Labour | 130 | 5% | Not elected |
| Election Candidate | Party | Votes | % | Outcome |
|---|---|---|---|---|
| Liberal Democrats | 1047 | 56% | Elected | |
| Reform UK | 293 | 16% | Not elected | |
| Green Party | 254 | 13% | Not elected | |
| Conservatives | 220 | 12% | Not elected | |
| Labour | 71 | 4% | Not elected |
 South East Water Announces New CEO-Designate
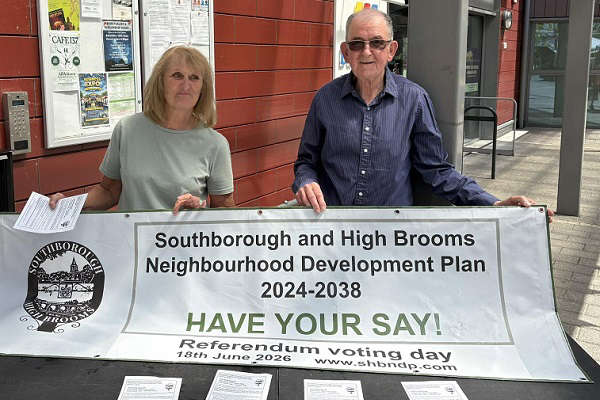 Local Neighbourhood Development Plan Approved
 Sevenoaks Volunteers Awarded
 Silver Award for Hadlow College
 Girlguiding Award for Lily Hemsley
 Permanent Home for Tonbridge Banking Hub
 Air Ambulance Marathon Fundraising
 South East Water CEO David Hinton Finally Resigns