
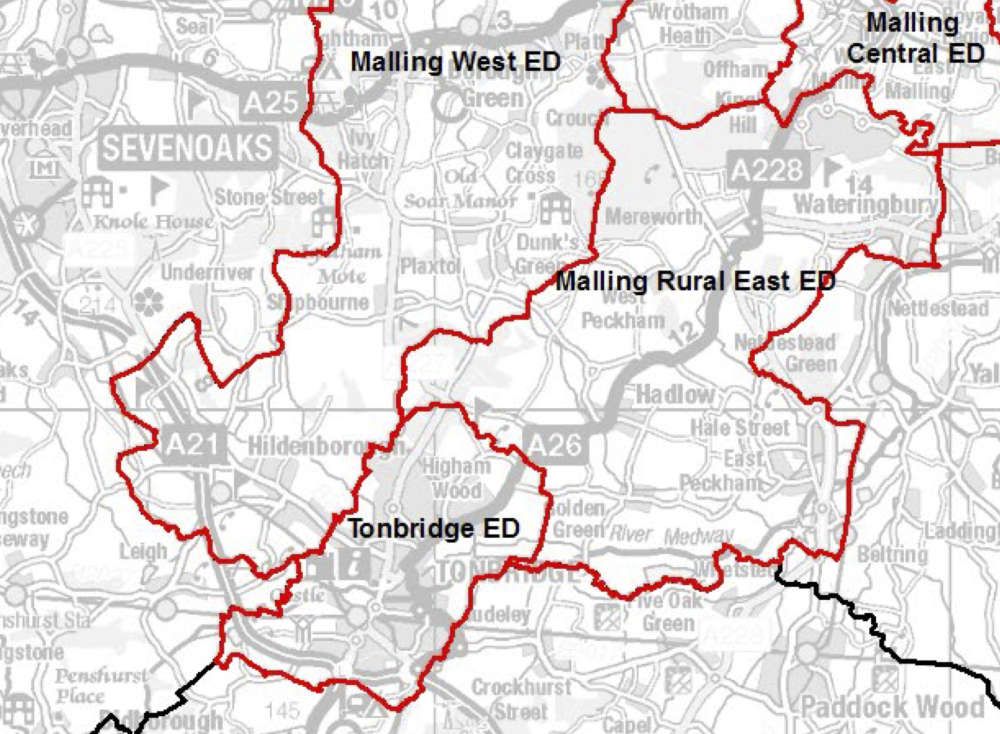
The Green Party has won both seats it was defending in Tonbridge town at the final Kent County Council elections.
Unlike most seats, the electoral division of Tonbridge elects the top two candidates. Last time the Green Party's Mark Hood took 27% and the Green Party's Paul Stepto took 23% and were both elected.
Mark Hood (pictured below) and Paul Stepto both stood again and won comfortably. They won 26% and 22% of the vote respectively.

Listen here to councillors and candidates reacting to the Tonbridge result, as well as the news that Nigel Farage's Reform UK party had taken overall control of Kent County Council, with the Conservatives slumping from 55 councillors to just 5 councillors.
Mark Hood of the Greens told us: "We are very relieved - having seen what's happened around Kent - that people have put their faith in us as a team. They recognise the hard work of the Green Party".
Mark Hood continued: "They're (Reform UK) a protest party, so how they are going to get to grips with the world of municipal government is going to be interesting. We are all going to be intrigued how they are going to fulfil their election promises, particularly keeping council tax frozen while maintaining the services that our residents rely on".
Reform UK had promised in its campaign to freeze council tax, cut wasteful spending, support business, axe "woke" policies and provide more social housing for local people.
The Conservatives did hang onto two seats to the west and east of Tonbridge town..
Residents in Hildenborough voted in the MALLING WEST division and Harry Rayner (pictured below) of the Conservatives was elected.

Harry Rayner told West Kent Radio: "For me it's a very sad day to see the loss of such valued and helpful colleagues and also the huge amount of experience that they have had in KCC over the years. I was around as a councillor (not a County Councillor) when the opposition won previously in the mid 1990s and I saw the hash that was made of the administration that time."
Residents in Hadlow voted in the MALLING RURAL EAST division and Sarah Hudson (Conservative, pictured below) was elected.

TONBRIDGE DIVISION
| Election Candidate | Party | Votes | % | Outcome |
|---|---|---|---|---|
| Green Party | 5415 | 26% | Elected | |
| Green Party | 4533 | 22% | Elected | |
| Reform UK | 2355 | 11% | Not elected | |
| Conservative | 2188 | 11% | Not elected | |
| Conservative | 2025 | 10% | Not elected | |
| Reform UK | 1856 | 9% | Not elected | |
| Liberal Democrat | 997 | 5% | Not elected | |
| Liberal Democrat | 651 | 3% | Not elected | |
| Labour | 433 | 2% | Not elected | |
| Labour | 305 | 1% | Not elected |
MALLING WEST - including Hildenborough
| Election Candidate | Party | Votes | % | Outcome |
|---|---|---|---|---|
| Conservative | 2162 | 46% | Elected | |
| Reform UK | 1206 | 25% | Not elected | |
| Green Party | 626 | 13% | Not elected | |
| Liberal Democrat | 438 | 9% | Not elected | |
| Labour | 315 | 7% | Not elected |
MALLING RURAL EAST - including Hadlow
| Election Candidate | Party | Votes | % | Outcome |
|---|---|---|---|---|
| Conservative | 2140 | 43% | Elected | |
| Reform UK | 1538 | 31% | Not elected | |
| Green Party | 732 | 15% | Not elected | |
| Liberal Democrat | 374 | 7% | Not elected | |
| Labour | 244 | 5% | Not elected |
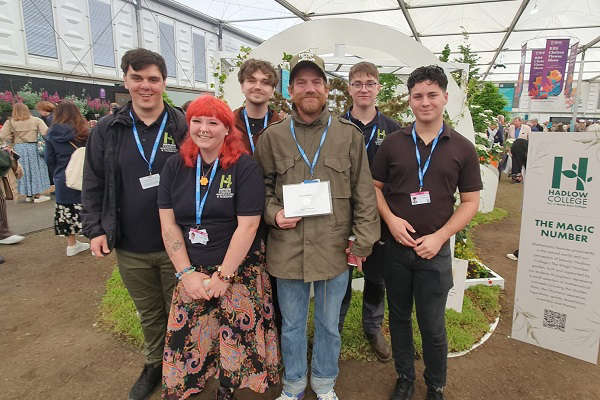 Silver Award for Hadlow College
 Girlguiding Award for Lily Hemsley
 Permanent Home for Tonbridge Banking Hub
 Air Ambulance Marathon Fundraising
 Local Council Election 2026 Results
 South East Water CEO David Hinton Finally Resigns
 Campaign to Save Snooker Hall
 Stag Theatre is NOT for Sale


Comments
Add a comment